GFI ClearView AI brings application performance, per-user statistics, live traffic, reports and alerts into one dashboard, so you can prevent downtime.
GFI ClearView AI predicts potential issues from patterns in past network activity, and turns your utilization and configuration data into ready-to-go recommendations.
✦ GFI ClearView AI
Illustrative
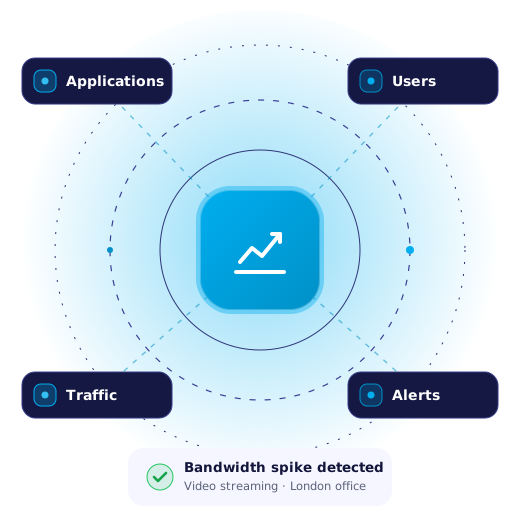
Why is the CRM slow for the London office?
Likely cause: 1. WAN link at 94% utilization since 9:05 2. Top talker: video streaming 3. CRM performance score down to 4/10
Recommendation: prioritize CRM traffic on the WAN link.
Predictive troubleshooting
Spots potential issues from patterns and past network activity.
Application traffic insights
In-depth detail on how applications are used, not just a list of them.
GenAI recommendations
Ready-to-go configuration recommendations for your admins.
What it does
From live traffic to audit-ready reports.
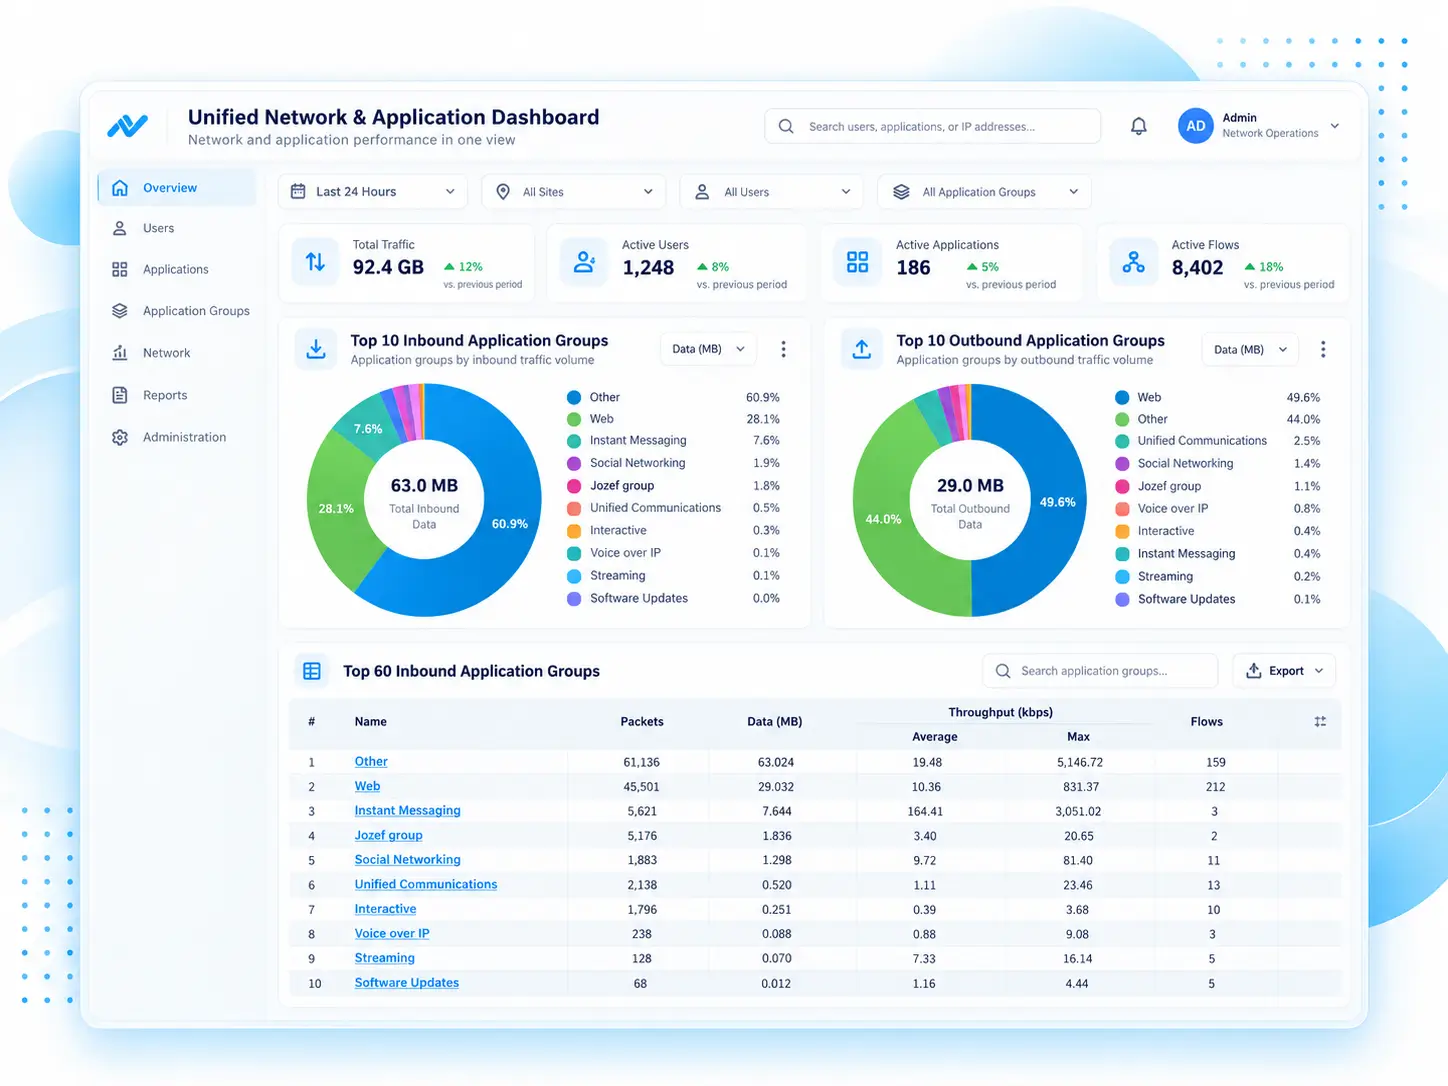
One unified dashboard
Network and application performance in one view.
See which applications use the most bandwidth. GFI ClearView natively recognizes thousands of applications and lets you define your own.
Per-user and per-application views
Pre-defined or custom application groups
Complements your firewall and security tools
● ● ●
GFI ClearView AI
Find critical issues
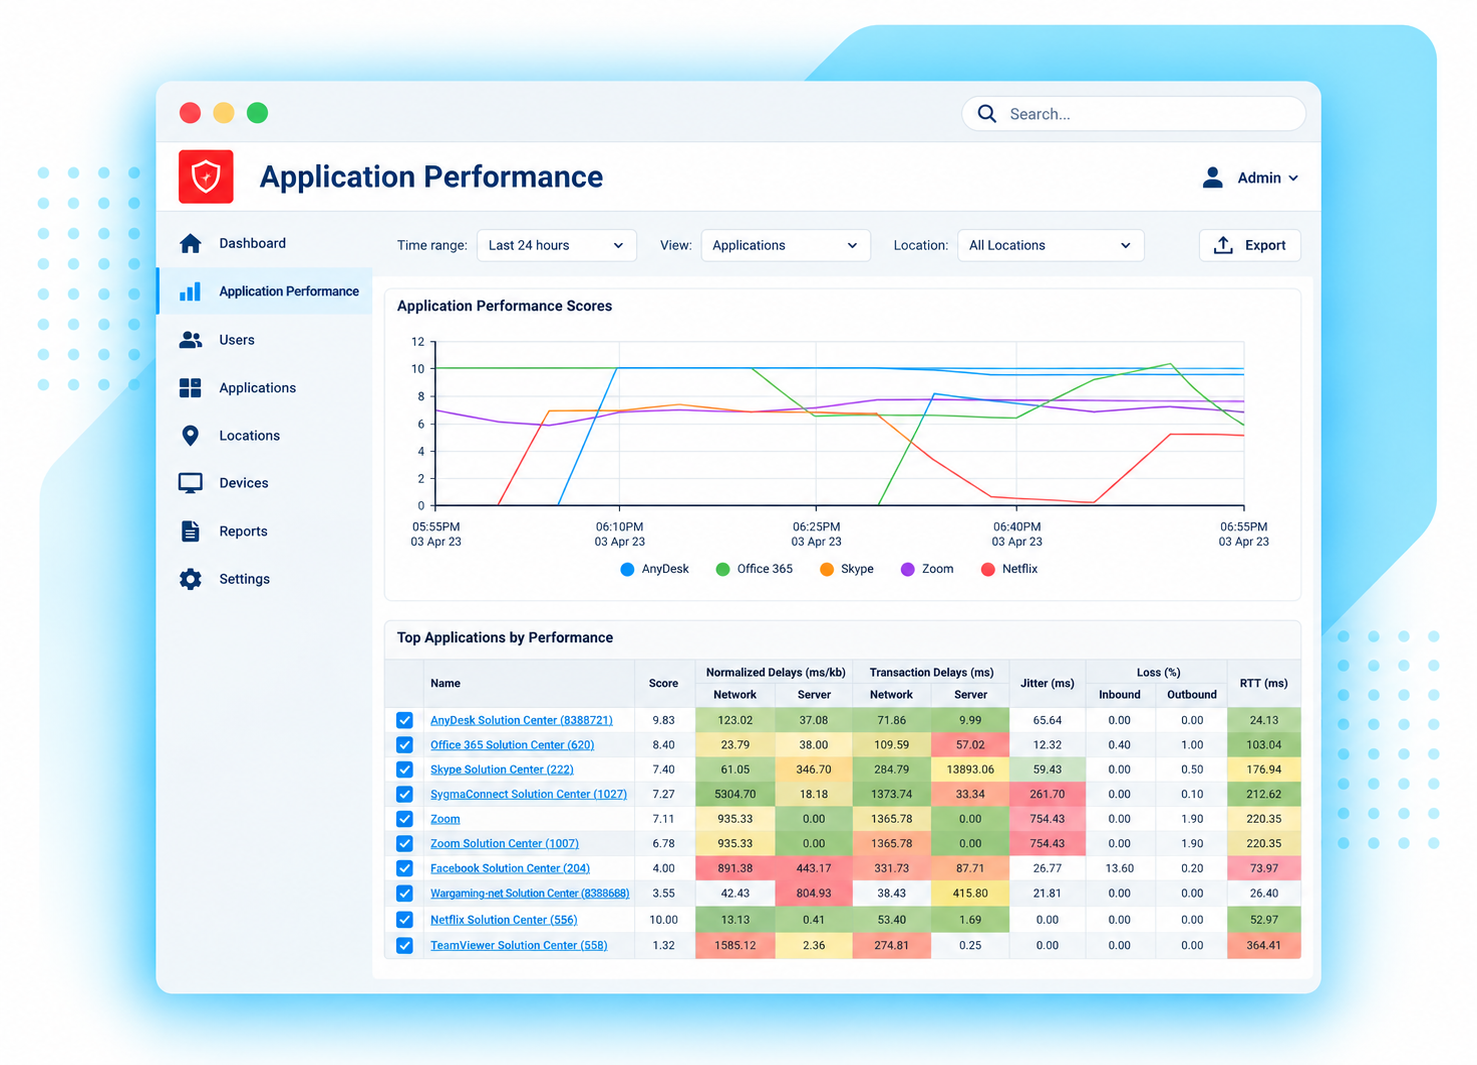
Pinpoint what’s hurting your applications.
Monitoring starts as soon as you deploy, with a 1-second refresh for near-immediate visibility.
Per-user monitoring via Active Directory
Application performance scores from 1 to 10
Spot bottlenecks fast
● ● ●
GFI ClearView AI
Stay ahead of problems
Prevent performance problems before they hit.
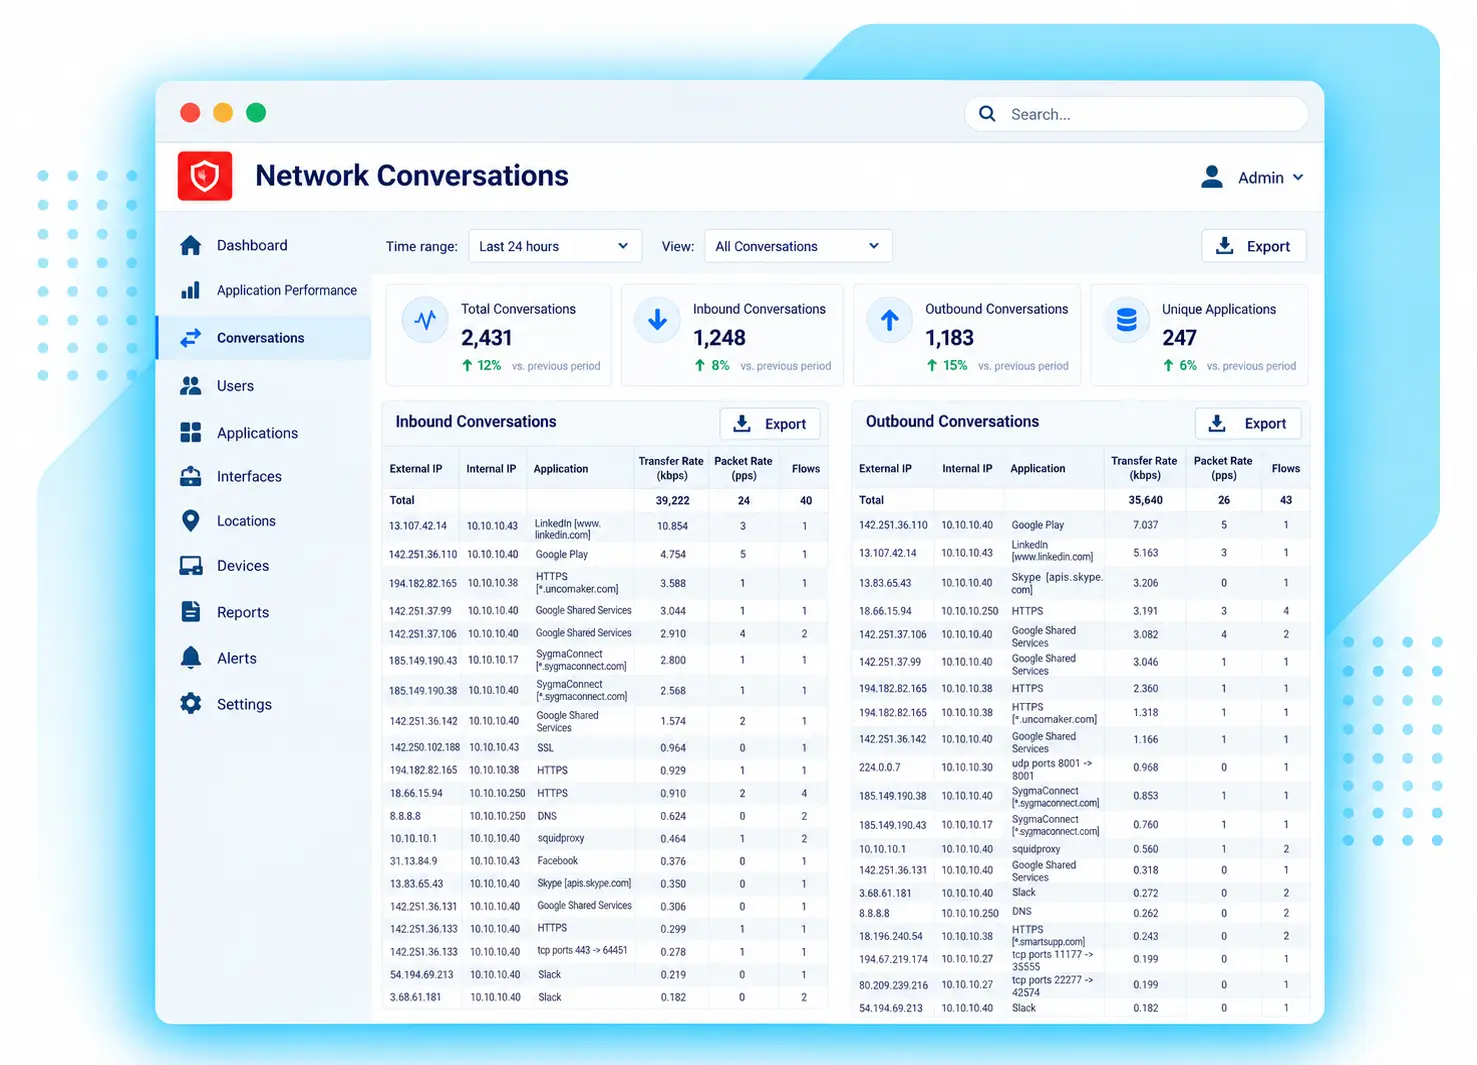
Peak analysis shows your top talkers and listeners at any point in time, so you can act before users are affected.
See all applications, not just the top few
Identify rogue applications
Link performance monitoring
● ● ●
GFI ClearView AI
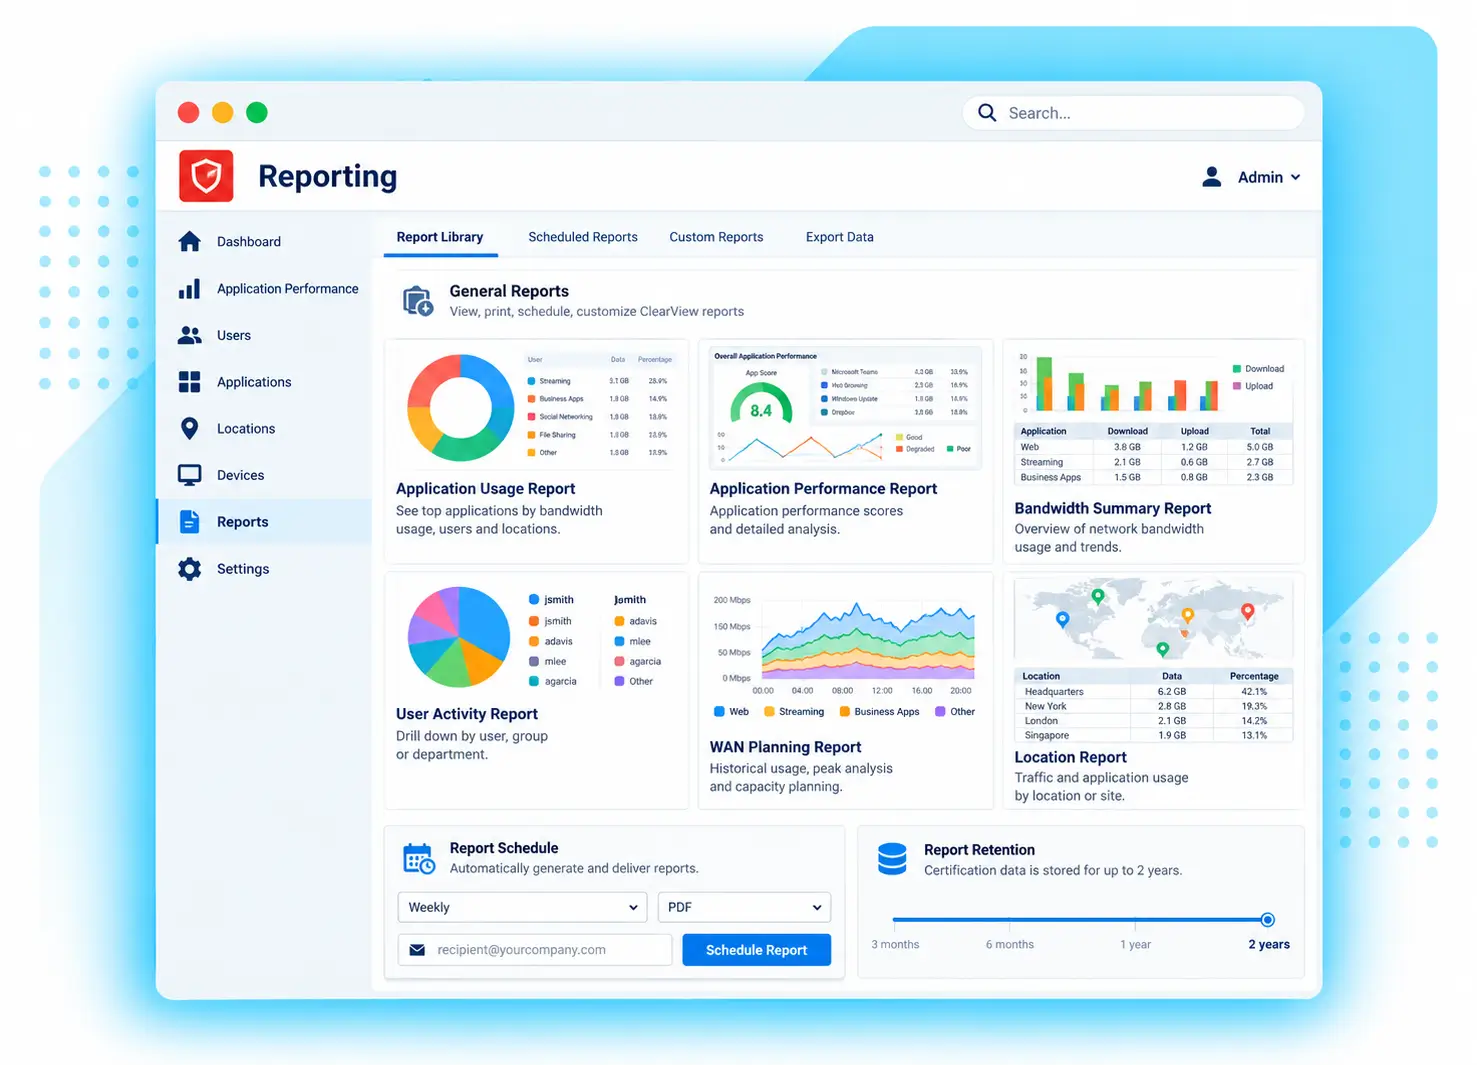
Built-in reporting
Reports that make certification easier.
Analyze individual applications or groups, and aggregate data from your SOC or third-party tools.
Report library for WAN planning and governance
Automatic aggregation and summaries
Certification data kept for up to two years
● ● ●
GFI ClearView AI
Why GFI ClearView AI
Nine good reasons to monitor with GFI ClearView.
Single dashboard
Performance, per-user stats, traffic, reports and alerts in one place.
VM deployment
Runs on a virtual machine. No new hardware, lower TCO.
Performance reports
Report catalogs for WAN planning, performance and governance.
Configurable alerts
You choose the triggers, the recipients and the content.
Log exporting
Export logs to your SIEM to expand your data sources.
Continual network auditing
Ongoing controls testing against your policies and procedures.
Data gathering and retention
Aggregate data from your SOC and other tools for reporting.
Real-time monitoring
Monitoring starts immediately, with near-instant visibility.
Path to network shaping
A direct route to traffic shaping when you need it.
ONE CONSOLE
Manage GFI ClearView AI alongside every GFI product.
GFI AppManager AI puts health, alerts and reports for all your GFI products in one cloud console.